Outputs & Diagnostics
Each run writes enough metadata to inspect the construction afterwards. The
most important files are under ROQ_data and Plots.
Run Directory
Before the ROQ object is initialised, the command creates the base output directory. It contains:
JenpyROQ.log;the copied configuration file;
git_info.txt;ROQ_data/, includingROQ_metadata.txt,full_frequencies.npyand thelinear/andquadratic/array directories;Plots/, includingBasis_parameters/andWaveform_comparisons/.
The config file is copied into the run directory so the stored arrays can be traced back to the exact input settings.
JenpyROQ.log records parsed configuration values, default markers, basis
construction progress, outlier counts, validation settings and timing
information when timing = 1.
git_info.txt records the active git branch, latest commit hash, configured
git author and current diff. This file is written at config-read time.
ROQ Arrays
The linear and quadratic subdirectories use the same file naming
pattern, with linear or quadratic inserted in the filename.
File |
Meaning |
|---|---|
|
Basis vectors produced by the pre-selection loop. |
|
Parameter points associated with pre-selection basis vectors. |
|
Largest projection residual found at each pre-selection step. |
|
Enriched basis stored during the ROQ construction loop. |
|
Parameter points associated with enriched basis vectors. |
|
Matrix used to reconstruct full-grid waveforms from empirical-node samples. |
|
Physical frequencies selected as empirical interpolation nodes. |
|
Integer indices of those frequencies on |
The top-level ROQ_metadata.txt stores:
f-min         f-max   seglen
<value>       <value>         <value>
The top-level full_frequencies.npy stores the original construction grid.
Reduction Factor
The log reports:
<type> basis reduction factor:
(Original freqs [N_full]) / (New freqs [N_roq]) = N_full / N_roq
This is a grid-size reduction diagnostic. The realised parameter-estimation speedup also depends on likelihood implementation, waveform-call cost, interpolation overhead and I/O.
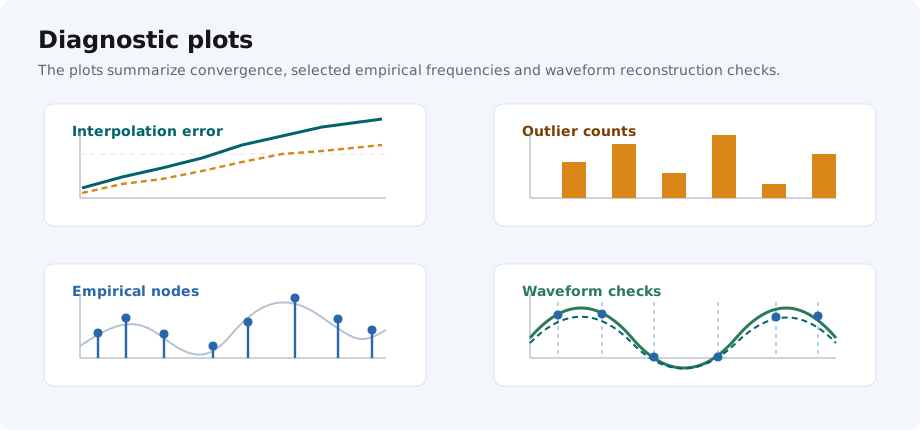
Diagnostic Plots
Plot |
Interpretation |
|---|---|
|
Largest projection residual retained during pre-selection. |
|
Maximum interpolation error recorded while adding enriched basis elements. |
|
Number of training points above the current cycle tolerance after each enrichment step. |
|
Histogram of empirical frequencies. |
|
Post-construction validation errors on random test points. |
|
Fractional reconstruction error for |
|
Fractional reconstruction error for |
|
Full-grid waveform, ROQ reconstruction and empirical-node samples. |
|
Distribution of parameter values selected for basis elements. |
Post-Processing Only Mode
Set:
[I/O]
output = existing_run_directory
post-processing-only = 1
In this mode the code skips construction and loads:
ROQ_data/<type>/empirical_frequencies_<type>.npy
ROQ_data/<type>/empirical_nodes_<type>.npy
ROQ_data/<type>/basis_interpolant_<type>.npy
ROQ_data/<type>/basis_waveform_params_<type>.npy
If an old run lacks empirical_nodes_<type>.npy, the code recovers node
indices by searching full_frequencies.npy for the stored empirical
frequencies.
Practical Checks
Before using a basis in inference, inspect:
validation errors relative to
tolerance-linandtolerance-qua;whether outlier counts reached the requested values in every enrichment cycle;
empirical-frequency histograms for unexpected clustering at boundaries;
waveform-comparison plots for the configured
[Test_values]point;basis-parameter histograms for gaps in the intended training domain.